What is SuperWEB2?
SuperWEB2 is an interactive, browser-based data portal for accessing, manipulating, interrogating, and downloading primary datasets from StatsSA including National Census data, Community Survey data, and Labour Force Survey data. Using 2011 National Census data, this step-by-step tutorial shows you how to select and download data for all wards in South Africa. The same steps can be used to download data for other geographic areas of interest.
NOTE: In order to use SuperWEB2, you must register for a free account. This can be done from the SuperWEB2 login page. Once you have created your account, and successfully logged in, follow the steps outlined below.
Step 1: Locating the dataset
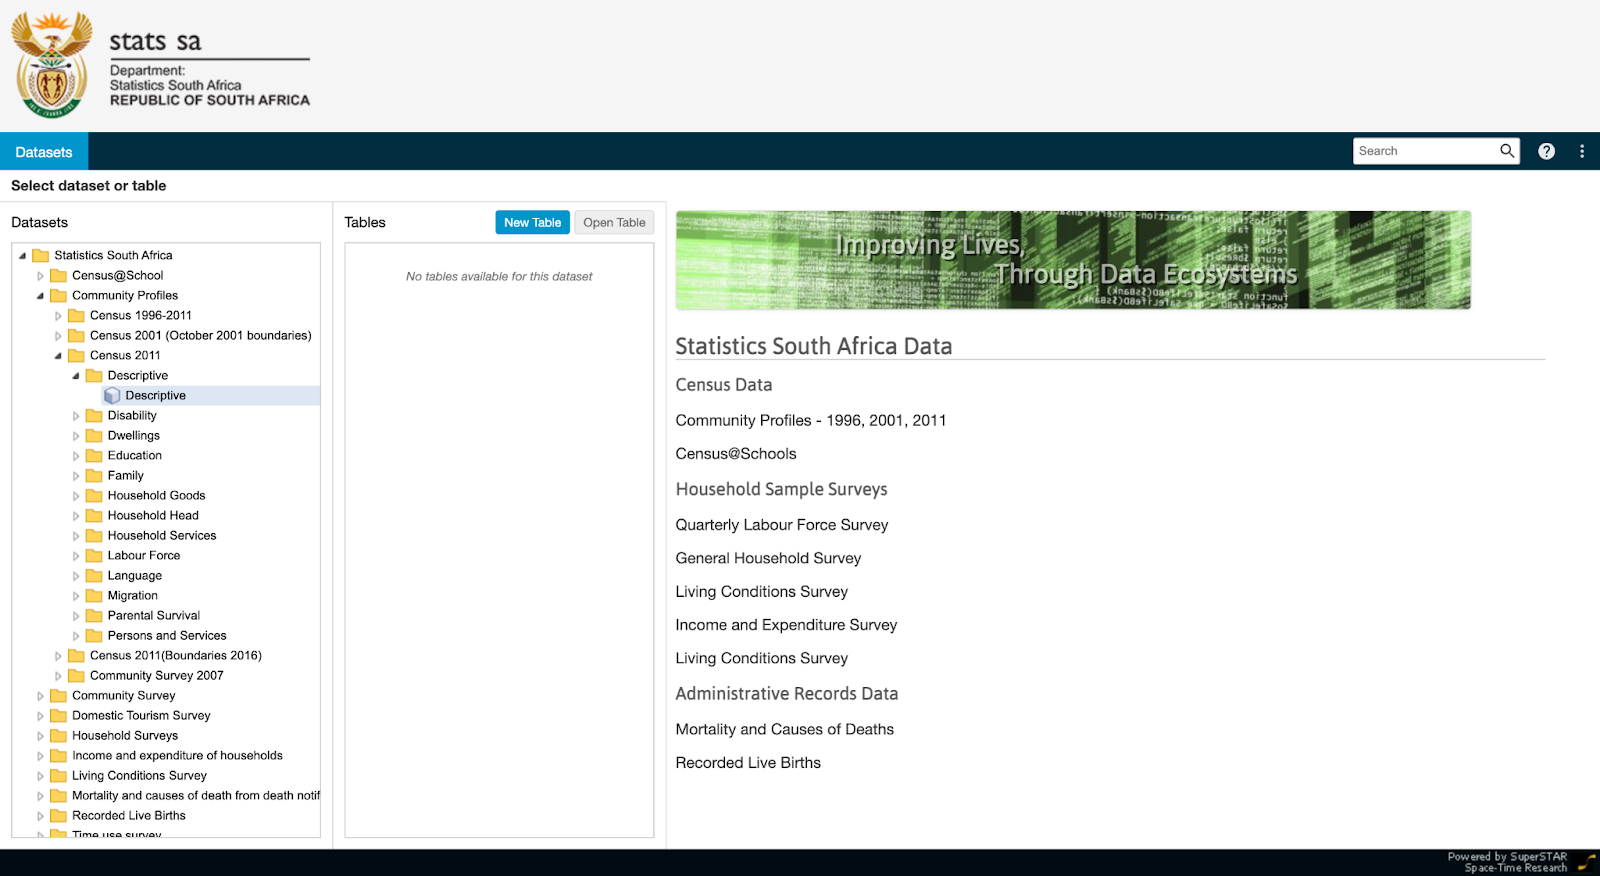
Once you have logged in, the first step is to locate the data you are looking for — in this case, the 2011 National Census data. As shown in the image below, the datasets are located in the leftmost panel, in a tiered folder structure. The 2011 National Census data has a number of subsets. We will use the Descriptive subset. This is located under Statistics South Africa > Community Profiles > Census 2011 > Descriptive. Once located, select the dataset, and click the button labelled ‘New Table’ (in blue).
Step 2: Selecting the geographic areas
After clicking ‘New Table’, a new window will appear (see the image below). In the leftmost panel there is another tiered folder structure. Expand Geography by clicking on the small triangle to the left. This will show the 9 provinces of South Africa. Each of these can also be expanded to show districts, metros, municipalities and wards. That said, wards can be selected without having to expand to the ward level.
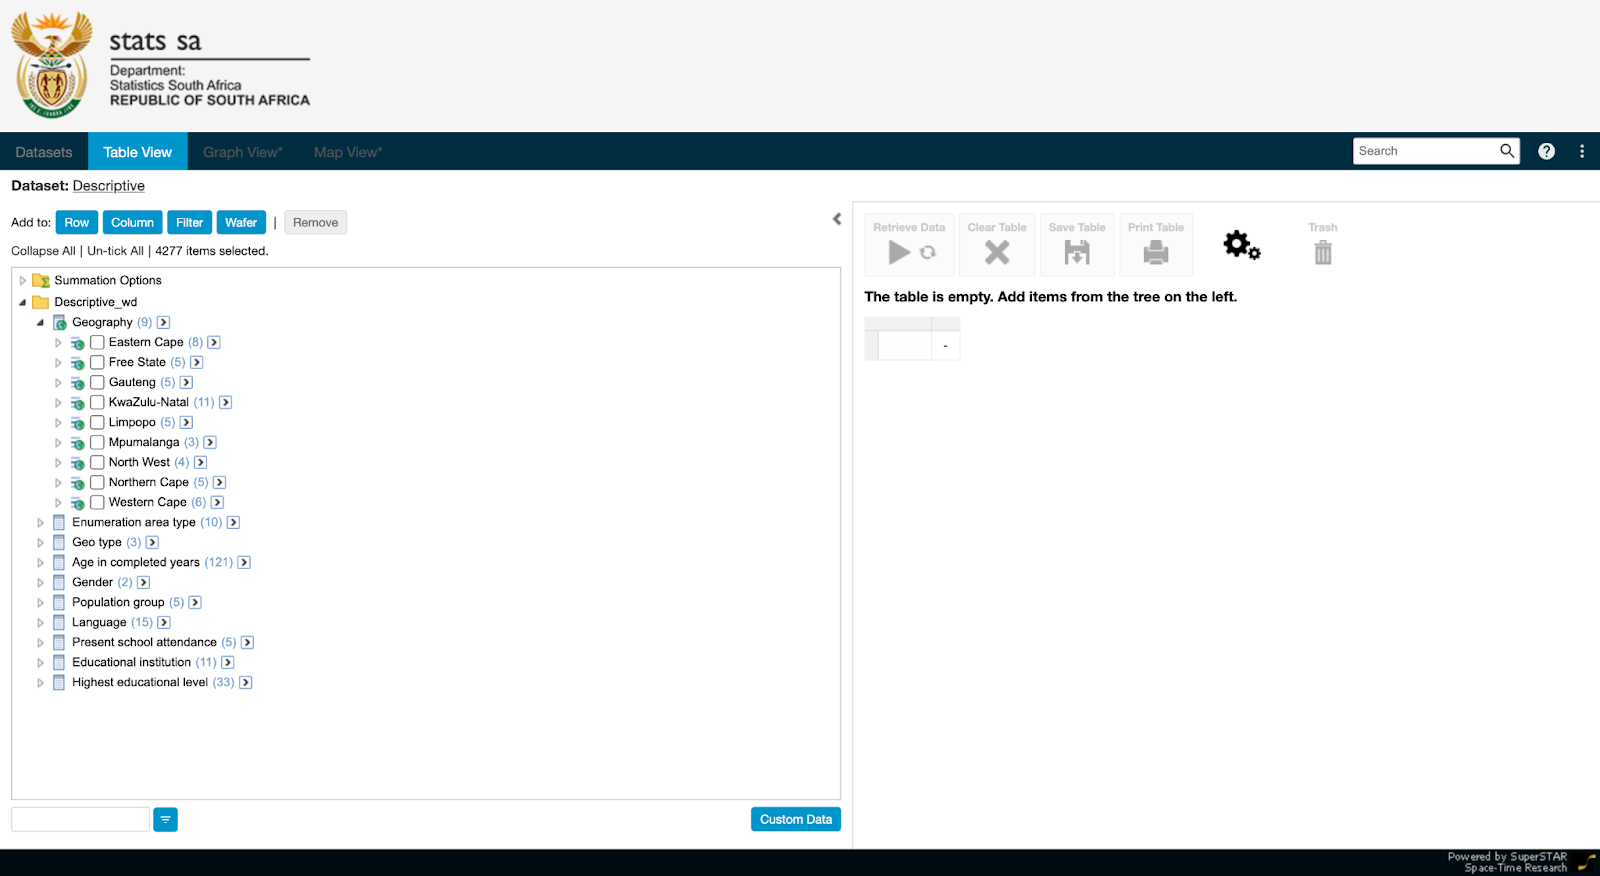
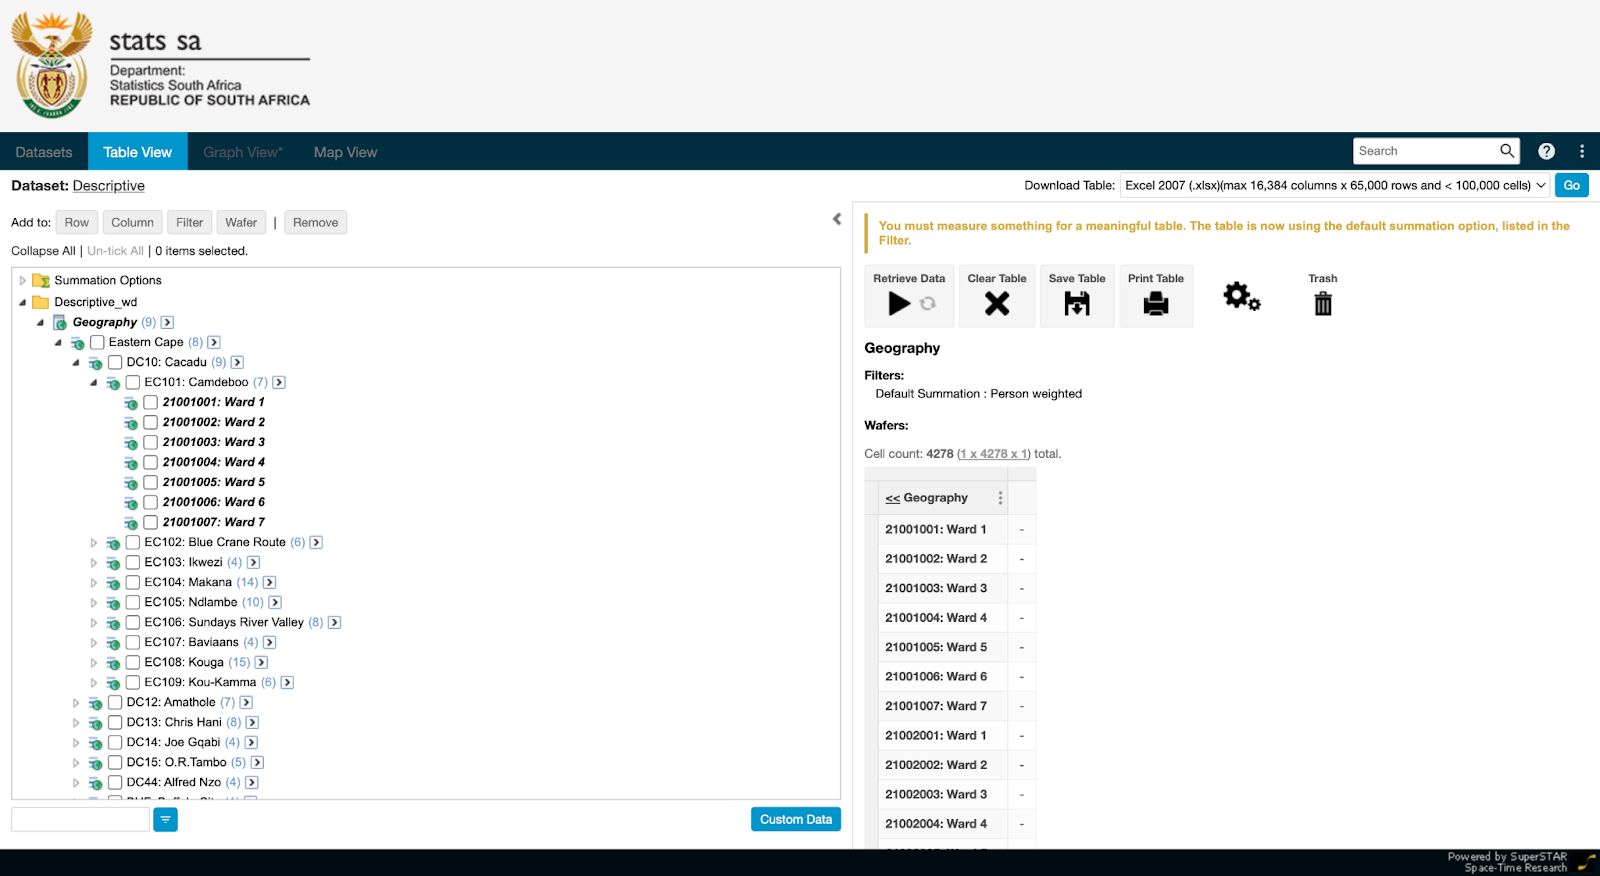
Clicking on the arrow-block to the right of Geography opens a small pop-up with four options. Clicking on South Africa by Electoral Ward will select all wards in South Africa. This can be confirmed by expanding to the ward level (see image below).

NOTE: Clicking on South Africa by Electoral Wards will only select and retrieve data for wards. If you would also like to retrieve data for municipal, district, metro, or provincial geographies, click (from the same small pop-up) Municipal Boundaries, DC Metros, or Provinces respectively.
Since metros are included in both Municipal Boundaries and DC Metros, selecting and retrieving data for both municipal and district geographies will result in duplications for metro data. See, for example, Buffalo City and Nelson Mandela Bay in the image below.
Step 3: Adding geographies to the table
Once you have your geographies of interest selected in the leftmost panel, it is time to add them to a table (in the rightmost panel). To do this, simply click on the ‘Row’ button above the leftmost panel. This will create 1 row per geographic area selected — in this example, all the wards of South Africa (see the image below).
NOTE: The table will not display any values until you select and add an indicator of interest. Additionally, if you only want the geography codes of wards (and not the names too), click the three dots next to Geography and select ‘Codes’.
Step 4: Selecting & adding indicators
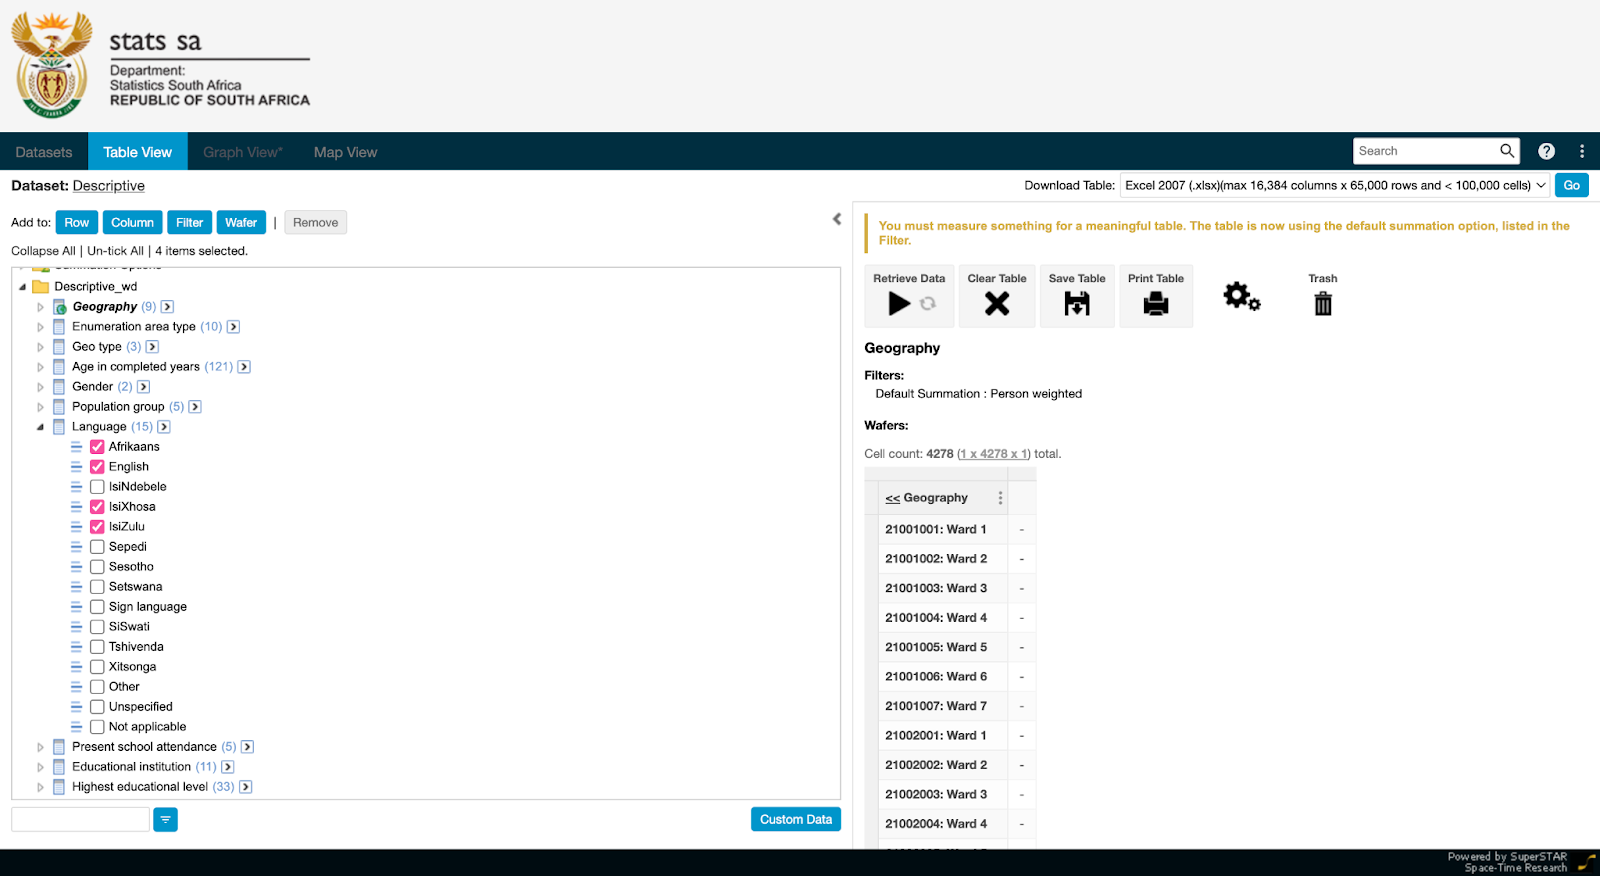
Start by collapsing (minimising) Geography. Below Geography you will see a number of indicator groups — Age in completed years, Gender, Population group, Language, etc.
Let’s assume you are interested in the 4 most spoken languages of South Africa — isiZulu, isiXhosa, Afrikaans, and English. First, you expand Language by clicking the small triangle to the left. Next, you select our languages of interest (see image below).
Next, you add the selected languages to the table as columns by clicking on the ‘Column’ button above the leftmost panel. Once the column headers have been added, click on the ‘Retrieve Data’ button above the rightmost panel. SuperWEB2 will now populate the table accordingly (see image below).
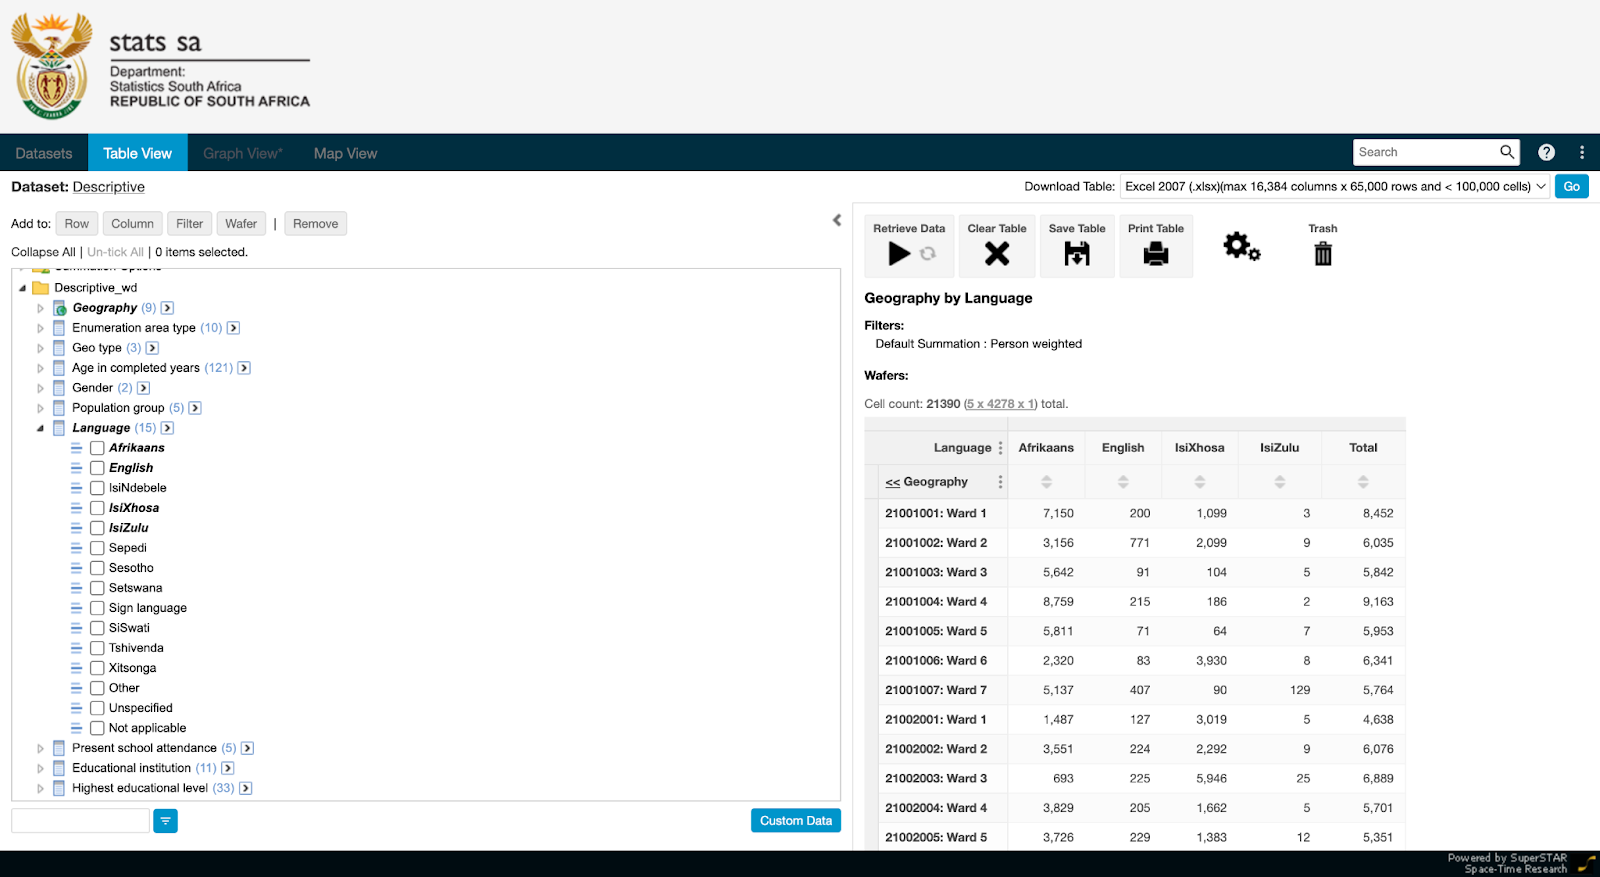
For this example, we are not interested in totals. To switch this off, click on the three dots next to Language and Geography in the table, and deselect ‘Total’ (see image below).

Step 5: Downloading your data
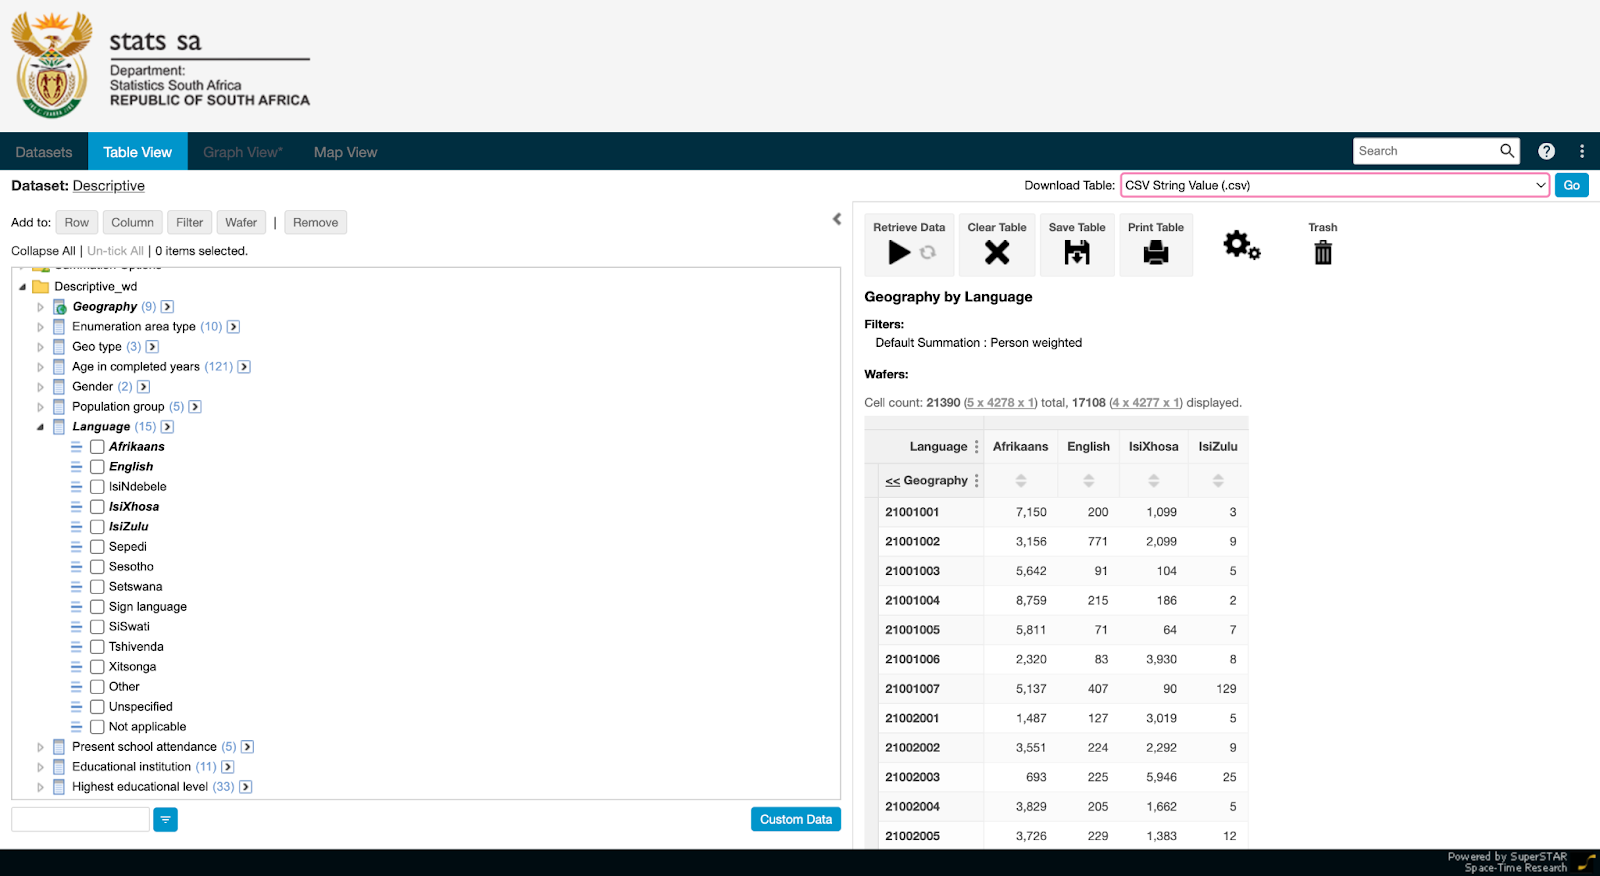
Depending on how many indicators you are adding to your table, SuperWEB2 might not be able to display the entire dataset. In this case, you can download your data.
Above the rightmost panel, there is a dropdown list titled ‘Download Table’. Multiple formats are available, but we recommend the CSV string value (.csv) option. This will provide you with a file with rows for each geography and language selected. The Comma Separated Value (.csv) option will provide you with the geography code once, followed by the languages and respective values.
Depending on the size of the dataset you are downloading, it may take a few seconds to prepare and download. Once the data has been downloaded, you can open it in Excel, Google Sheets, LibreOffice, etc. You will see that SuperWEB2 creates a column called ‘Summation Options’, ‘Geography’, ‘Language’, and the ‘Count’ (the number of people that speak the language for the ward in question).
Click here to view the video tutorial.


