In 1996, South Africa held its first democratic census. Children born that year were 26 years old at the time of the 2022 Census and are 30 today, meaning they now form part of the country’s core working-age population.
This single fact captures both the passage of time and the scale of demographic change. But it also raises a deeper question:
How has South Africa’s population changed since 1996, and has that change unfolded in the same way everywhere?
National totals confirm that the country has grown. What they do not reveal is where growth occurred, who moved, who stayed behind, and how communities have changed in age, gender and population group. These shifts matter. They shape school enrolments, housing demand, healthcare pressures, labour markets and the financial sustainability of municipalities.
This analysis looks beyond national averages to explore how South Africa’s population has changed since 1996, and why it matters where you live.
National overview: the population has changed shape
South Africa’s population did not simply grow between 1996 and 2022. It fundamentally changed shape.
In 1996, the population had a classic youth-heavy profile: a wide base of children and teenagers narrowing steadily with age. By 2022, that base had narrowed, the middle had thickened, and older age groups made up a larger share than they did a generation ago.
This shift reflects declining fertility, improved life expectancy and the movement of large cohorts born in the late 1980s and 1990s into older age groups. The result is a country no longer dominated by children and teenagers. Instead, the largest share of the population now falls within working-age groups (20-69), alongside a steadily growing elderly population (70+).
This creates a complex policy environment. On the one hand, a large working-age population presents an opportunity. If sufficient jobs are created, economic growth can accelerate and dependency pressures ease. On the other hand, South Africa has struggled to convert this potential into broad-based prosperity.
Several constraints stand out:
- High unemployment: The economy has not generated enough jobs for new labour market entrants. Overall unemployment remains above 30 per cent, with youth unemployment far higher.
- Skills mismatch: Many workers lack the skills employers demand.
- Persistent inequality: Gains are uneven across population groups.
- Low savings: High household dependency and low incomes limit capital accumulation.
At the same time, population ageing is gradual but clear. Healthcare, pensions and social support systems will face growing pressure in the decades ahead.
Nationally, these changes appear steady and manageable. But national averages smooth over large local differences. The same age-structure shifts that look modest at country level can be dramatic in individual municipalities. Some areas remain extremely youthful; others already resemble much older societies.
Understanding the national picture is only the starting point. The key question is:
How differently has this transition played out across the country?
Growth was not evenly distributed
Between 1996 and 2022, South Africa’s population increased from 40.6 million to 62.0 million. Yet this growth was far from evenly spread.
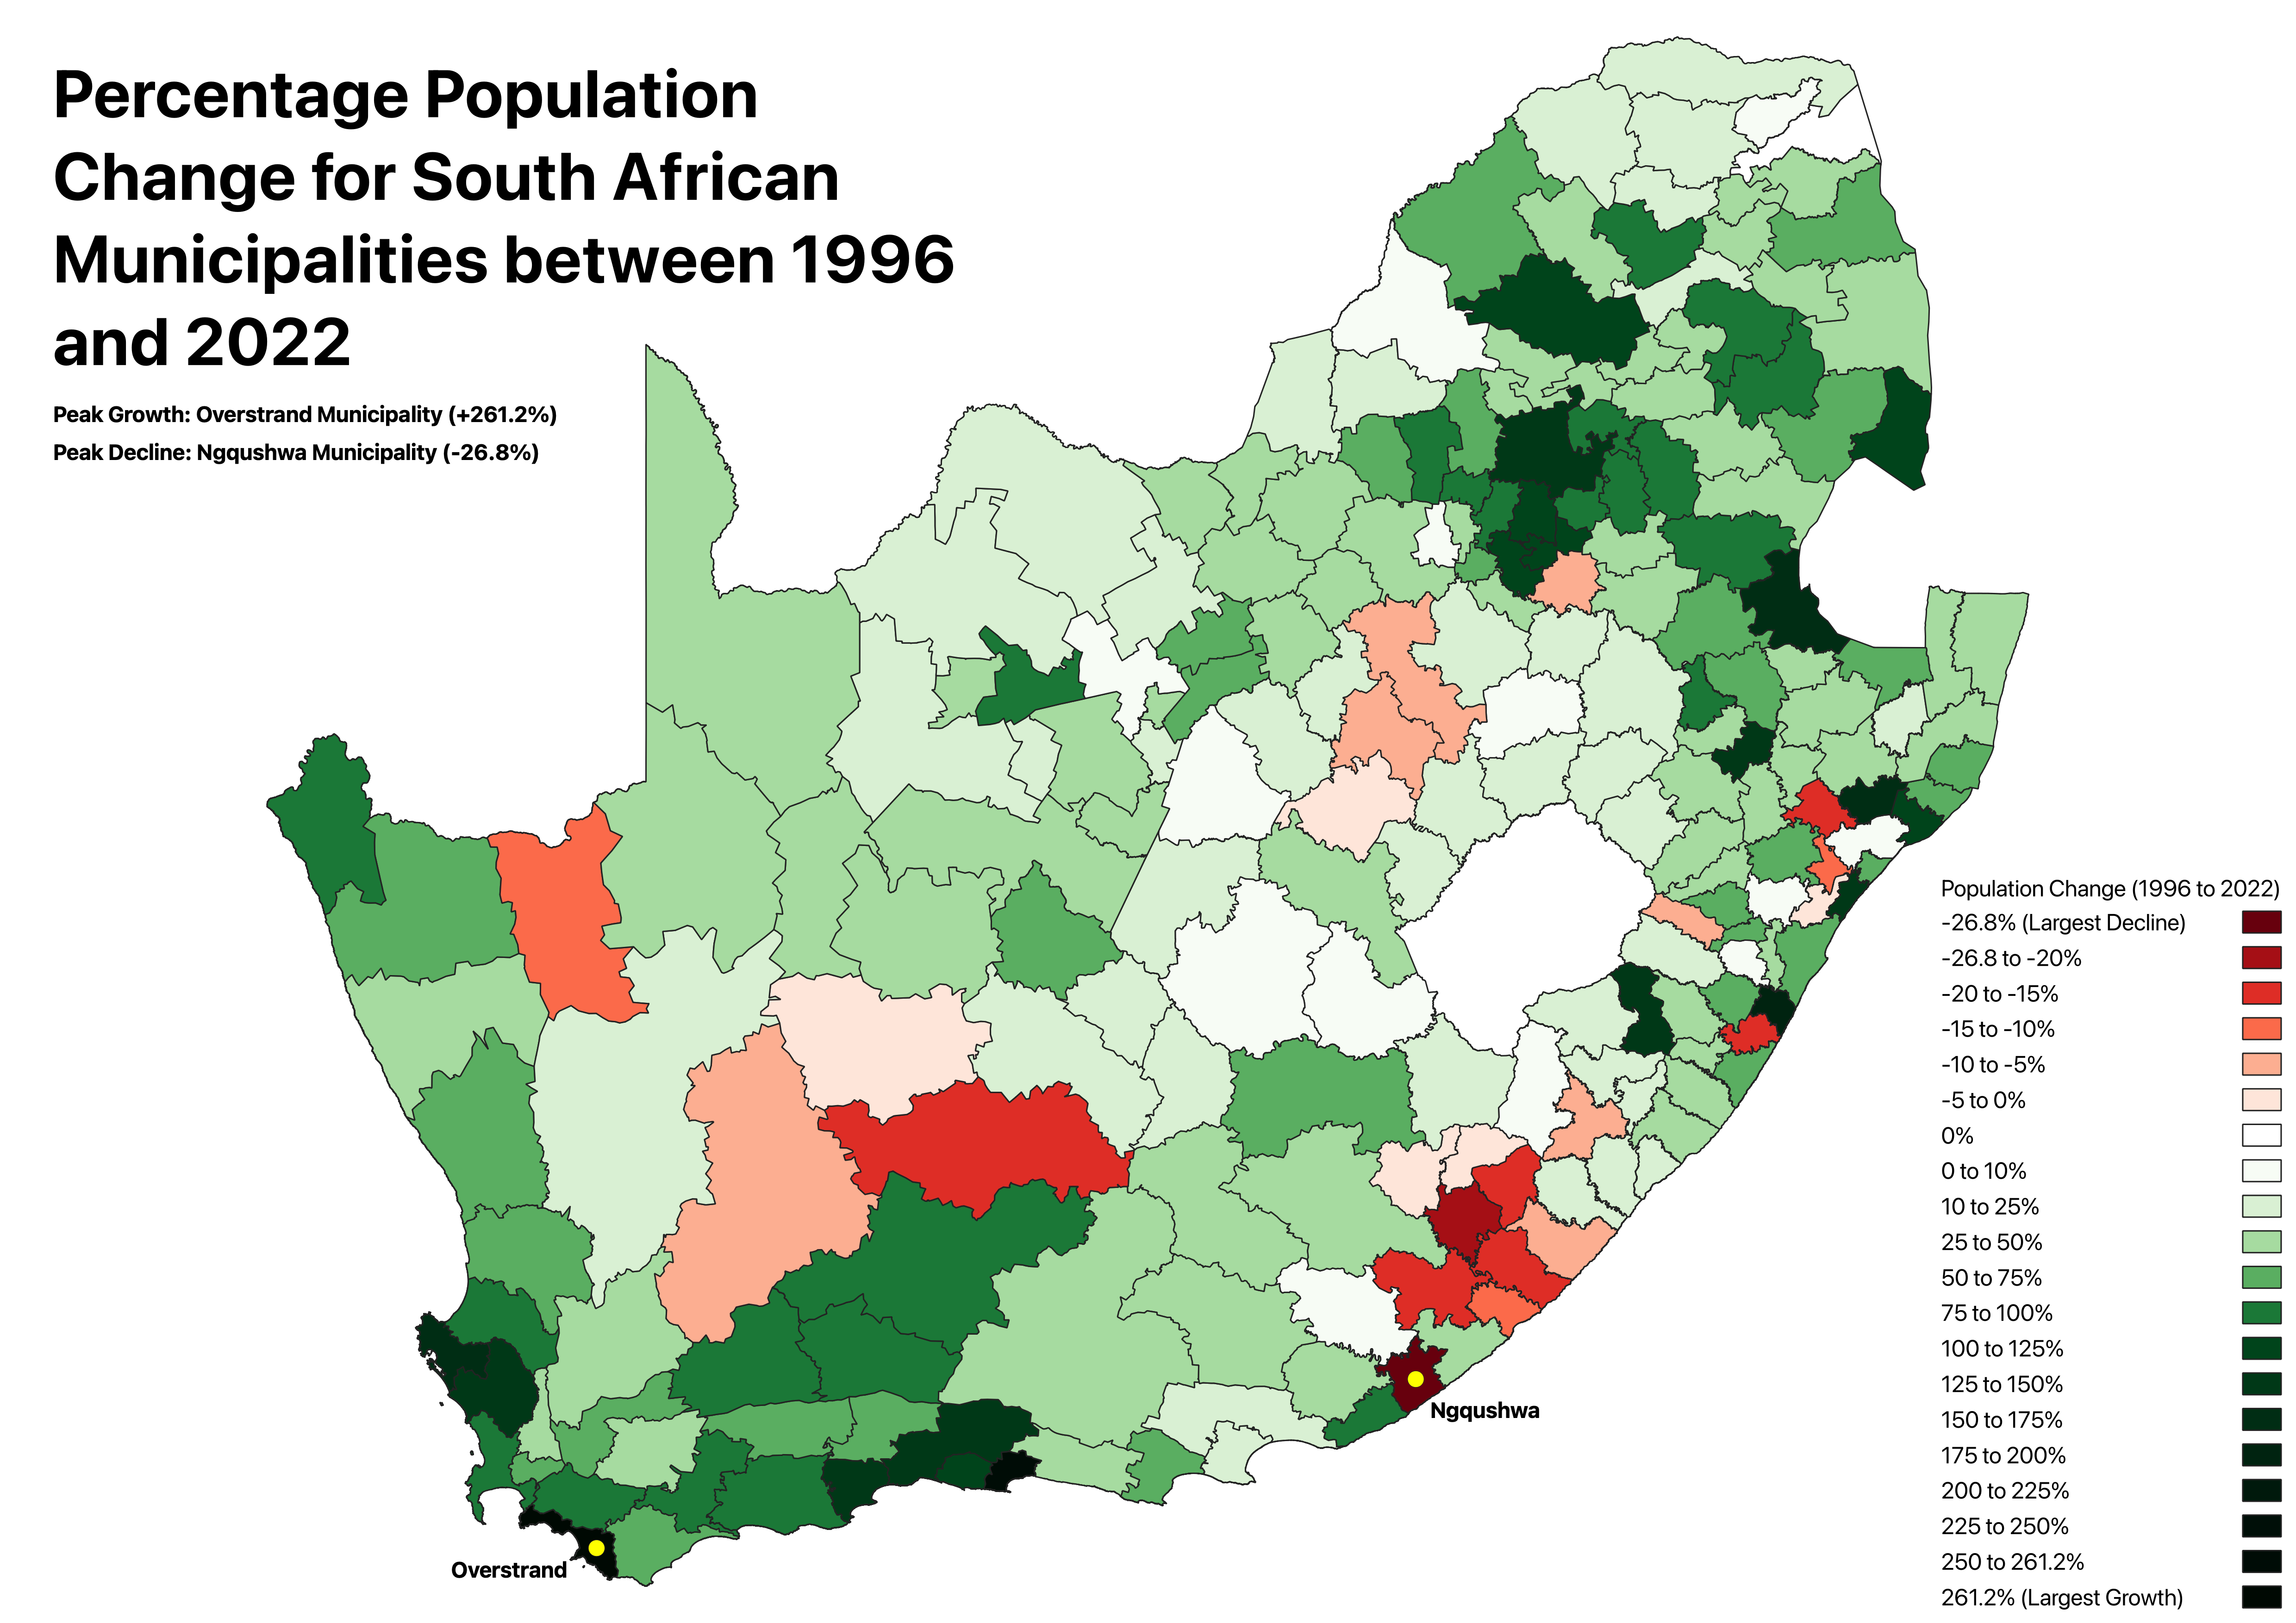
Population expansion clustered around major metropolitan areas, secondary cities and economic corridors. Many rural municipalities, especially those distant from labour markets, experienced slow growth, stagnation or decline.
These patterns reflect opportunity. Municipalities that grew rapidly did so not only because of births, but because they attracted working-age migrants seeking employment, education and better services. Growing areas typically offer:
- Access to jobs and training
- Developed infrastructure
- Proximity to economic hubs
For example, Overstrand Municipality’s population increased by 261.2 per cent between 1996 and 2022. Its 2023/24 annual report links this growth partly to in-migration into the Western Cape, but particularly to people relocating from larger cities in search of improved quality of life.
By contrast, Ngqushwa Municipality experienced a population decline of 26.8 per cent over the same period. Reports attribute this largely to younger residents leaving in search of employment.
Importantly, declining areas are not necessarily “emptying out”. Many are ageing in place, as younger adults depart and older residents remain.
The result is a widening demographic divide between municipalities that attract people and those that lose them. Yet rapid growth brings its own pressures. Fast-growing areas face strain on housing, water, sanitation, electricity, transport and municipal finances. Shrinking municipalities confront narrowing tax bases while service demands persist or shift.
Population change reshapes local capacity in different ways, depending on direction.
More than growth: who is changing, and how fast?
Headcounts alone do not capture the full story. Equally important is how population composition has shifted.
Nationally, the share of children and teenagers declined between 1996 and 2022, while the working-age population expanded. Older residents also increased, though from a relatively small base.
At the municipal level, however, patterns diverge sharply.
Msinga Municipality remains overwhelmingly youthful, with roughly half its population under 20 in 2022. This sustains demand for schools, early childhood services and entry-level employment opportunities.
Overstrand Municipality presents a contrasting profile, with 10.2 per cent of residents aged 70 or older. Here, pressure falls more heavily on healthcare, social support and age-friendly infrastructure.
Looking only at a single year can be misleading. Thabazimbi Municipality had the largest working-age share in 2022, at 70.4 per cent. Yet its structure was already mature in the mid-1990s, and change over time was modest.
Sakhisizwe Municipality tells a different story. Its working-age share increased by about 17.4 percentage points between 1996 and 2022, reflecting significant structural change. Yet its total population declined slightly. This suggests ageing in place and youth out-migration, rather than a large influx of adults.
Percentage-point shifts therefore capture demographic momentum, not just end states. They reveal where younger cohorts are moving into adulthood, where migration is reshaping communities, and where structural transformation is underway.
.png)
Gender and population group: hidden shifts beneath the surface
Nationally, gender balance appears stable. Women remained the majority between 1996 and 2022, and the overall distribution changed only slightly.
At the municipal level, however, patterns vary considerably.
Msinga Municipality had one of the highest female shares in 2022. Thabazimbi had one of the highest male shares. In some areas, changes were dramatic. Merafong City Municipality shifted from a heavily male-dominated profile in 1996 towards greater balance by 2022, reflecting changes in mining settlement patterns. Musina Municipality moved in the opposite direction, with men increasing their share, likely linked to labour migration in mining, agriculture and cross-border trade.
Population group trends show similar divergence.
Nationally, the Black African share increased from roughly 76.7 to 81.4 per cent between 1996 and 2022. The White share declined from 10.9 to 7.3 per cent, though absolute numbers remained broadly similar. Other groups shifted more modestly.
Locally, however, trajectories differ.
In Bitou Municipality, the Black African share more than doubled, reshaping the demographic profile through rapid in-migration. Laingsburg Municipality remained relatively stable, reinforcing its existing population structure. uMngeni Municipality diversified, with multiple groups growing and producing a more balanced composition, while Kouga Municipality experienced rebalancing across groups, alongside signs of ageing (see below).
These cases illustrate that population change is not simply about expansion. It is about which groups are growing, which are ageing, and how local identities evolve over time.
Bringing it together: age, gender and group combined
When age, gender and population group are examined together, the national transition fragments into distinct local realities.
Nationally, the story is one of a narrowing youth base, a thickening working-age middle and gradual ageing. This is driven mainly by the Black African population, whose working-age cohorts expanded for both women and men.
At municipal level, however, different combinations of fertility decline, migration and economic opportunity produce very different outcomes:
- Bitou Municipality: Growth is concentrated among working-age Black African men and women. Coloured and White shares are thin, even if their absolute numbers grow. The municipality became younger, more working-age, and more concentrated in one group.
- Laingsburg Municipality: The pyramid remains dominated by the Coloured population. Change is modest and reinforces the existing profile.
- uMngeni Municipality: Working-age growth spreads across multiple groups, producing a more balanced structure. This matches earlier patterns of diversification rather than dominance.
- Kouga Municipality: Older cohorts expand, driven by growth in the White population. The Coloured share declines, while the Black African share remains stable, producing ageing and group reshaping simultaneously.
Some municipalities grow through in-migration of working-age adults. Others age as younger residents depart. Some diversify across groups, while others become more concentrated. In other words, the same national forces generate very different local futures.
Population change is therefore not abstract. It is spatial and deeply contextual.
What this adds up to
Population change cannot be reduced to a single headline number. Growth rates matter, but they do not capture structure, momentum or composition.
Nationally, South Africa’s demographic transition appears gradual. Locally, it is uneven and sometimes abrupt. Municipalities of similar size can face very different challenges depending on their age structure, gender balance and population group composition.
Planning for housing, schools, healthcare, transport, labour markets and social support depends not just on how many people live in a place, but who they are and how those proportions are shifting.
The data points to a clear conclusion:
Population change is not uniform and it is not neutral. It plays out municipality by municipality, shaped by age, gender and population group. Recognising that complexity is essential to understanding South Africa’s demographic future.
Explore the data yourself!
You can explore Census data from 1996, 2001, 2011 and 2022 on OpenUp’s Wazimap platform. The interactive maps and charts allow you to compare municipalities, track trends across age, gender and population groups, and examine how your municipality has changed over time.
South Africa’s demographic story is not a single national curve. It is thousands of local stories, and the data lets you see them unfold.


